
Application performance monitoring (APM) is the systematic practice of collecting and analyzing telemetry data from live software applications to detect, diagnose, and resolve performance issues before end users are affected. Industry leaders like Google Cloud, Dynatrace, and New Relic have built entire product lines around this discipline because the cost of undetected degradation is measured in lost revenue and broken user trust. APM goes beyond watching CPU graphs. It connects user-facing symptoms, like slow page loads or failed transactions, to their root causes in backend traces, logs, and errors. For IT professionals and system administrators, APM is the difference between proactive reliability management and reactive firefighting.
What is application performance monitoring and why does it matter?
APM is defined as the use of specialized tools and telemetry to continuously track application response times, error rates, and resource utilization. The goal is to detect and resolve issues before end users experience degradation. That definition matters because it separates APM from simple uptime checks or server health dashboards.
The importance of application performance is direct and measurable. A slow application costs you users. A crashing application costs you credibility. APM gives your team the visibility to act before either happens.

APM also provides a code-level and distributed view that goes well beyond infrastructure metrics like CPU usage. Tracking response times and error rates at the transaction level reveals bottlenecks that a host-level dashboard will never surface. That depth is what makes APM indispensable for modern software environments.
What are the essential application performance metrics?
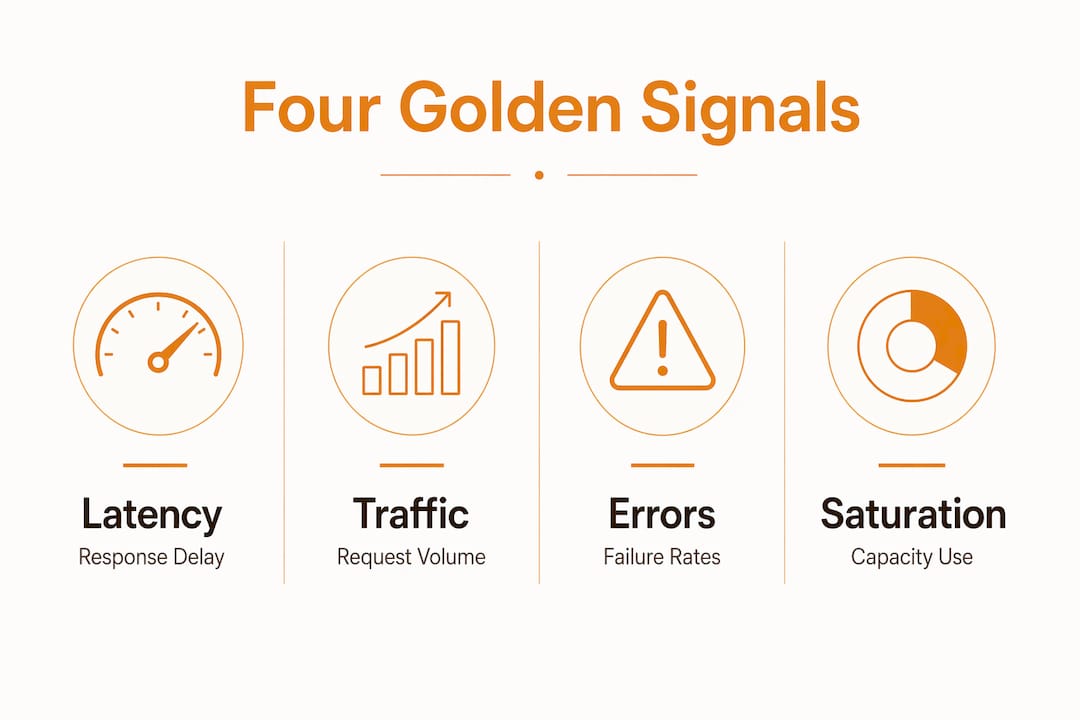
The four golden signals form the foundation of any serious APM strategy. Latency, traffic, errors, and saturation capture user experience and system health in four numbers that enable rapid incident triage. Every other metric you track should connect back to at least one of these signals.
Here is what each signal tells you:
- Latency measures how long a request takes to complete. High latency is the first signal users notice, often before your alerting system does.
- Traffic measures the volume of requests hitting your system. A sudden drop in traffic can indicate a failure just as clearly as a spike in errors.
- Errors track the rate of failed requests. Even a 1% error rate on a high-traffic service translates to thousands of failed user interactions per hour.
- Saturation measures how close a resource is to its limit. A queue that is 90% full will become a bottleneck before it hits 100%.
These four signals work together. Latency alone does not tell you whether a slowdown is caused by a saturated database or a spike in traffic. Correlating all four signals gives you a complete picture and speeds up root-cause analysis significantly. For example, rising latency combined with high saturation on a specific service points directly to a capacity problem, not a code bug.
Pro Tip: Set alert thresholds on all four golden signals, not just errors. Teams that only alert on error rates miss latency and saturation problems until they become outages.
How do application monitoring tools work technically?
APM tools capture performance data through three primary instrumentation methods: agents, SDKs, and auto-instrumentation libraries. Agents run alongside your application process and intercept calls at the runtime level. SDKs, like those provided by OpenTelemetry, let developers add telemetry directly to application code. Auto-instrumentation libraries handle common frameworks automatically, reducing the manual work required to get started.
Once data is captured, the APM platform aggregates and correlates it across three signal types: traces, metrics, and logs. A trace records the full path of a single request as it moves through your system. Metrics provide aggregated counts and measurements over time. Logs capture discrete events with context. The platform links all three together so you can move from a user complaint to a specific line of code in minutes.
Distributed tracing is the capability that makes APM genuinely powerful in modern architectures. A single user request often traverses multiple services, and without end-to-end correlation, root-cause analysis becomes imprecise and slow. Distributed tracing records the full execution path across every service involved, pinpointing exactly where latency or errors originate within a microservices architecture.
The result is near real-time insight into application behavior. Most enterprise APM platforms, including those built on OpenTelemetry standards, process and surface this data within seconds of collection. That speed is what allows teams to catch a degrading service before it triggers a user-visible outage.
Pro Tip: Start instrumentation with OpenTelemetry. It is vendor-neutral, widely supported, and proper instrumentation means you will never need to add debugging code after an incident to understand what happened.
APM vs. observability vs. infrastructure monitoring
These three terms are often used interchangeably. They are not the same thing, and confusing them leads to gaps in your monitoring coverage.
APM focuses on application-level performance and user impact. It answers the question: is my application performing as expected for users? Observability is a broader discipline that aggregates logs, metrics, and traces to assess the overall health of a system. It answers the question: can I understand the internal state of my system from its external outputs? Infrastructure monitoring watches the health of the underlying hosts, networks, and containers. It answers the question: are my servers running?
The table below shows how these three approaches differ in scope, focus, and primary use case.
| Dimension | APM | Observability | Infrastructure monitoring |
|---|---|---|---|
| Primary focus | Application transactions and user experience | System-wide health across all signals | Host, network, and container health |
| Data types | Traces, transaction metrics, error rates | Logs, metrics, traces (all three pillars) | CPU, memory, disk, network I/O |
| Root-cause depth | Code-level and service-level | System-wide correlation | Host-level only |
| Best for | Diagnosing slow or failing user requests | Understanding complex system behavior | Detecting resource exhaustion |
| Typical tools | Dynatrace, New Relic, Datadog APM | Grafana, Jaeger, OpenTelemetry | Nagios, Zabbix, Prometheus |
Infrastructure monitoring alone is insufficient for deep application diagnostics. A server with healthy CPU and memory can still serve slow, error-prone responses if the application code has a database query bottleneck. APM catches that. Infrastructure monitoring does not.
Pro Tip: Treat APM, observability, and infrastructure monitoring as complementary layers, not competing choices. Most mature IT teams run all three and correlate alerts across them.
Best practices for performance monitoring
Effective APM implementation depends on decisions made before you deploy a single agent. The following practices separate teams that get real value from APM from those that generate noise.
- Instrument at the right level. Capture traces at service boundaries and within critical code paths. Over-instrumentation creates data volume problems. Under-instrumentation leaves blind spots. Focus on paths that directly affect user experience.
- Alert on golden signals, not just thresholds. Static thresholds on CPU or memory miss application-level problems. Build alerts around latency percentiles, error rates, and saturation metrics tied to your service-level objectives.
- Integrate APM into your incident workflow. APM data should feed directly into your incident management process. When an alert fires, the on-call engineer should reach the relevant trace and log data without switching tools or running manual queries.
- Avoid relying solely on aggregated host metrics. Focusing only on host-level data misses performance bottlenecks inside application transaction paths. Transaction-level correlation is what makes APM diagnostically useful.
- Review and tune your monitoring configuration regularly. Applications change. New services get added. Traffic patterns shift. A monitoring configuration that was accurate six months ago may now have gaps or generate false positives.
- Track mean time to resolution (MTTR). MTTR is the clearest measure of whether your APM practice is working. If MTTR is not decreasing over time, your instrumentation or alerting needs adjustment.
APM enables teams to move from reactive firefighting to proactive performance management. That shift only happens when the practices above are in place and consistently followed.
Pro Tip: Build a shared run book that maps each APM alert to a specific investigation procedure. New team members resolve incidents faster when the path from alert to diagnosis is documented and repeatable.
Key takeaways
APM is the most direct path from unknown application behavior to confident, proactive reliability management for IT teams.
| Point | Details |
|---|---|
| APM definition | APM collects and correlates telemetry to detect and resolve application issues before users are affected. |
| Four golden signals | Monitor latency, traffic, errors, and saturation as the core metrics for any APM strategy. |
| Distributed tracing | End-to-end tracing across microservices is required for accurate root-cause analysis in modern architectures. |
| APM vs. observability | APM focuses on user-facing application performance; observability covers broader system health across all signal types. |
| Best practice priority | Instrument at service boundaries, alert on golden signals, and integrate APM data directly into incident workflows. |
APM has changed how I think about reliability
The shift I have seen in teams that adopt APM properly is not just technical. It is cultural. Before APM, the standard incident response was to SSH into servers, run top, and grew through logs hoping to find something. That process took hours and often ended with a guess. APM changed the starting point entirely.
What surprised me most was how often the problem was not where anyone expected. A microservices' architecture makes this especially clear. A slow checkout flow might trace back to a single database call in an authentication service that nobody thought to watch. Without distributed tracing, that connection is invisible.
The teams I have seen struggle with APM share one pattern: they treat it as a dashboard to check rather than a system to act on. APM generates value only when alerts are wired to workflows and traces are reviewed during incidents, not after. The data is only as useful as the process built around it.
The next frontier is tighter integration between APM and AI-driven anomaly detection. Tools are already moving in this direction, correlating signals automatically and surfacing probable causes before an engineer opens a ticket. That capability will not replace experienced system administrators. It will make them significantly faster.
— Sadler
How Myserveriq supports your monitoring needs
IT teams that understand APM concepts still need a platform that puts those concepts into practice without adding complexity.

Myserveriq is built specifically for server administrators who need clear, actionable performance data without wading through irrelevant noise. The platform captures telemetry across your infrastructure, surfaces proactive alerts before issues escalate, and presents everything through dashboards designed for fast diagnosis. Myserveriq users report a 30% improvement in resource utilization based on real-world deployments. If your team is ready to move from reactive monitoring to genuine performance management, Myserveriq's platform is built for exactly that transition.
FAQ
What is application performance monitoring in simple terms?
APM is the practice of using tools to continuously watch how a software application behaves and performs. It collects data on response times, errors, and resource use to catch problems before users notice them.
How does APM differ from infrastructure monitoring?
APM tracks application-level behavior, including transaction traces and error rates at the code level. Infrastructure monitoring tracks host health metrics like CPU and memory, which cannot reveal application-specific bottlenecks.
What are the four golden signals in APM?
The four golden signals are latency, traffic, errors, and saturation. These four metrics capture user experience and system health and form the basis for effective incident triage.
Why is distributed tracing important for APM?
Distributed tracing records the full path of a request across every service it touches. Without end-to-end tracing, pinpointing the source of latency or errors in a microservices architecture is slow and imprecise.
What is the best way to start implementing APM?
Start by instrumenting your most critical user-facing services using a vendor-neutral framework like OpenTelemetry. Then build alerts around the four golden signals and integrate those alerts into your existing incident management workflow.