
Performance reporting for restaurant servers is defined as the systematic process of measuring, recording, and analyzing key service metrics to improve shift efficiency and income outcomes. For servers and bartenders who rely on variable pay, understanding your own performance data is the difference between guessing at your best shifts and knowing them with certainty. This client server performance reporting guide covers the metrics that matter most, the tools that make tracking easy, and the reporting practices that turn raw numbers into real decisions. Serveriq builds this exact framework into a $3 per month app that tracks tips, hourly wages, and shift patterns so food service workers can act on what the data actually shows.
What are the critical client server metrics for restaurant servers?
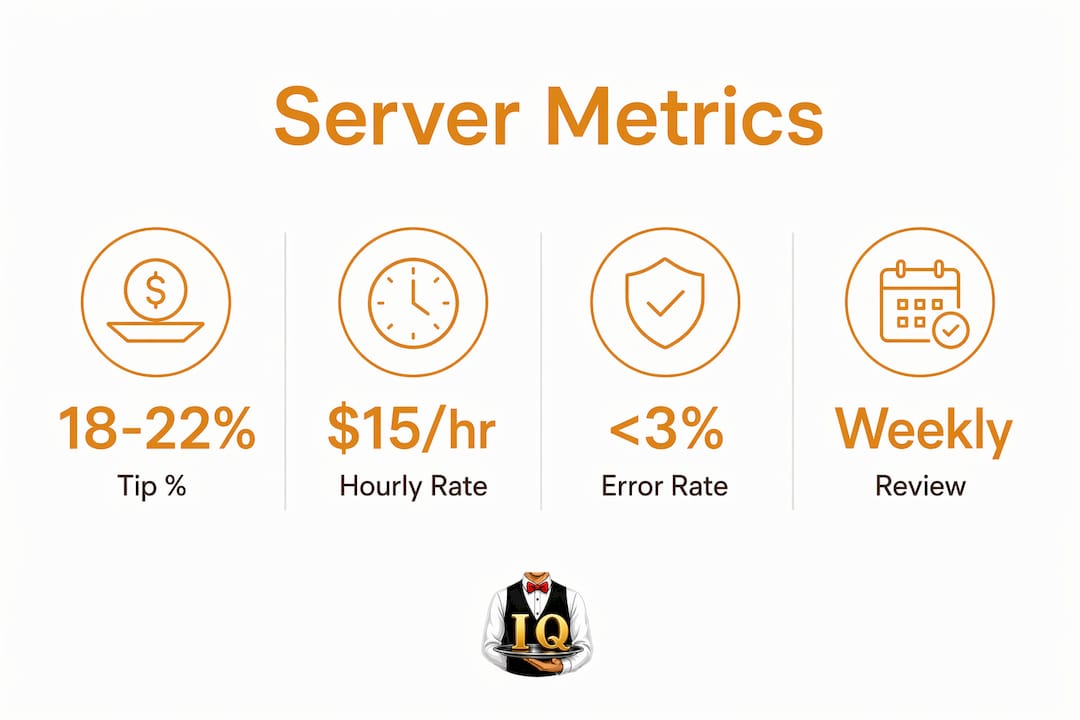
The most important metrics for restaurant servers fall into two categories: shift-level inputs and earnings outputs. Shift-level inputs include hours worked, tables served, and average check size. Earnings outputs include total tips, tip percentage per cover, and hourly effective rate after combining wages and tips.
Tracking tip percentage per cover is the single most revealing metric a server can monitor. A server averaging 18% on lunch shifts but 22% on dinner shifts has actionable data. That gap points directly to table type, menu mix, or guest demographics, not just effort.

Effective hourly rate is the metric most servers ignore and most need. A four-hour brunch shift paying $80 in tips looks strong until you compare it to a three-hour dinner shift paying $75. The dinner shift produced a higher effective hourly rate, which is the number that actually reflects earning power.
Error rates matter too, even in a restaurant context. Missed items, comped dishes, and voided checks all reduce net earnings and signal service breakdowns. Logging these alongside tip data gives a complete picture of shift performance rather than a flattering but incomplete one.
Pro Tip: Track your tip percentage on every shift, not just your total tips. Total tips rise and fall with table count, but tip percentage reveals your actual service quality trend.
Key metrics at a glance
| Metric | Target range | What it reveals |
|---|---|---|
| Tip percentage per cover | 18%–22% | Guest satisfaction and service quality |
| Effective hourly rate | Above your base wage goal | Real earning power per hour worked |
| Average check size | Varies by venue | Upsell effectiveness |
| Void and comp rate | As low as possible | Order accuracy and service errors |
| Shifts logged per week | Consistent with schedule | Completeness of your earnings record |
Which tools work best for tracking restaurant server performance?
Real user monitoring in a restaurant context means capturing what actually happened during your shift, not what you estimate at the end of the week. The best tools for servers combine voice input, automatic calculations, and visual reports so that logging takes seconds rather than minutes.
Client-side monitoring of response times and errors is required alongside server-side data to understand user experience fully. Applied to restaurant work, this means tracking both what you earned and where service broke down, because one without the other gives an incomplete picture.
Serveriq uses a virtual assistant named Chip that lets servers log shifts and update earnings through voice commands. That design choice matters. Servers finishing a closing shift at midnight are not going to open a spreadsheet. A voice command takes three seconds and captures the data before it fades.
Lightweight tracking apps suit most individual servers well. They handle tip logging, shift summaries, and basic trend reports without requiring IT knowledge. Enterprise platforms built for restaurant groups add payroll integration and multi-location reporting, but individual servers rarely need that depth. The right tool is the one you will actually use every shift.
- Voice input: Reduces friction so logging happens consistently, not occasionally.
- Automatic tip percentage calculation: Removes math errors and saves time.
- Shift comparison reports: Show trends across days, weeks, and months.
- Export options: Useful for tax preparation and income verification.
Pro Tip: Set a personal alert threshold for your effective hourly rate. If a shift falls below your target, review it the next day while details are fresh. Alerts should reflect persistent patterns, not single-shift anomalies.
The 5-minute rule from performance engineering applies here directly. An alert or concern only becomes worth acting on when it persists across multiple data points, not when a single bad shift spikes your anxiety. Symptom-based awareness beats reactive panic every time.
How to analyze and interpret your earnings data for better reporting
Raw shift data becomes useful only when you structure it into a clear report. Effective performance reports combine technical metrics with an executive summary framed in business impact language. For servers, that means translating numbers into plain statements: "My Tuesday lunch shifts average 14% tips versus 21% on Friday dinners. I should request more Friday evening sections."
A well-structured server performance report covers four areas. First, your baseline: what you typically earn per shift type. Second, your current period results compared to that baseline. Third, any anomalies, such as a week with unusually low tips tied to a new menu rollout. Fourth, one or two specific changes you plan to make based on the data.
Structured performance reports should include bottleneck analysis with root cause, impact, and prioritized recommendations. For a server, a bottleneck might be slow kitchen output during peak hours that forces longer table turns and reduces tip frequency. Naming that root cause in your report separates useful analysis from a list of complaints.
Visualizations make trends visible that raw numbers hide. A weekly tip percentage chart shows whether your performance is improving, declining, or flat. A shift-type breakdown by day of week shows where your earning power concentrates. Serveriq generates these reports automatically, so servers spend time reading insights rather than building charts.
Pro Tip: Frame your performance data in terms of service impact when sharing it with a manager. Instead of "my tips were low," say "my effective hourly rate dropped 12% during the new menu week, which aligns with longer order times." That framing gets attention and action.
Explaining p95 latency as "the slowest 5% of users wait over 3 seconds" improves stakeholder understanding in IT contexts. The same logic applies to restaurant reporting. Saying "my worst 20% of shifts earn below $15 per hour" is far more persuasive to a scheduling manager than "some shifts are slow."
What is the step-by-step process for a server performance reporting cycle?
A consistent reporting cycle turns scattered shift data into a reliable picture of your earning patterns. The process has five steps, and each one builds on the last.
- Set up your tracking tool before your first shift of the week. Confirm your wage rate, your venue, and your shift type categories are correctly entered. Garbage in means garbage out.
- Log every shift within 30 minutes of clocking out. Use voice input if available. Record total tips, hours worked, and any notable service issues like large comps or walkouts.
- Review your weekly summary every Sunday. Look at effective hourly rate, tip percentage, and shift count. Note any week-over-week changes above 10%.
- Run a monthly comparison report. Compare the current month to the prior month and to the same month last year if data exists. Identify your top three and bottom three shifts by effective hourly rate.
- Write one sentence of interpretation per report. "October was my strongest month because Friday dinner shifts averaged 23% tips." That sentence is your executive summary and your memory anchor.
Administrators should notify support teams at least 15 business days before scheduled performance testing in IT environments. For servers, the equivalent is coordinating with your manager before requesting schedule changes based on your data. Bringing a report to that conversation replaces guesswork with evidence.
Reporting cycle summary
| Step | Timing | Who acts |
|---|---|---|
| Tool setup and wage entry | Before week starts | Server |
| Shift logging | Within 30 minutes of each shift | Server |
| Weekly summary review | Every Sunday | Server |
| Monthly comparison report | First day of each month | Server |
| Manager conversation with data | Quarterly or as needed | Server and manager |
Common mistakes in this cycle include skipping shifts during busy weeks and then estimating, which corrupts your trend data. Another mistake is ignoring client-side errors such as comps and voids when logging. Those events directly reduce net earnings and belong in every report.
A server maintenance window in IT terms means a planned period for updates without disrupting users. For servers, your equivalent is a scheduled review period each week where you assess your data without the noise of an active shift clouding your judgment.
Key Takeaways
Consistent shift logging combined with structured monthly reports gives restaurant servers the clearest possible picture of their earning patterns and service performance.
| Point | Details |
|---|---|
| Track effective hourly rate | Combine tips and wages per hour to reveal your true earning power each shift. |
| Use voice input tools | Logging immediately after a shift prevents data loss and estimation errors. |
| Apply the 5-minute rule | Only act on performance concerns that persist across multiple shifts, not single anomalies. |
| Frame data in business terms | Tell managers how your metrics connect to service outcomes, not just raw numbers. |
| Run monthly comparisons | Month-over-month reports reveal earning trends that weekly snapshots miss entirely. |
What I've learned from tracking server performance the hard way
The biggest mistake I see servers make is treating tip tracking as a tax chore rather than a performance tool. They log the minimum, file their taxes, and wonder why their income feels unpredictable. The data they need to fix that is sitting in their pocket every shift.
Combining client-side and server-side performance data is essential for fully understanding system health. For servers, that means tracking both what you earned and what went wrong during the shift. A server who logs tips but never notes a comp or a walkout is missing half the story.
The communication gap between servers and managers is real, and performance data closes it. Projects with poor communication have a 40% higher rate of ignored performance issues. That statistic comes from IT, but it maps perfectly onto restaurant operations. A server who brings a one-page earnings summary to a scheduling conversation gets taken seriously. A server who says "I feel like I get bad sections" does not.
The other lesson is about alert fatigue. Alerts should be symptom-based rather than causing alert fatigue from static thresholds. If you panic every time one shift underperforms, you will burn out and stop tracking entirely. Build a threshold. Decide that three consecutive shifts below your target rate is the signal worth acting on. One bad shift is noise. Three in a row is a pattern.
Performance reporting is not about judging yourself. It is about giving yourself the information to make better decisions about your schedule, your section requests, and your service approach. The servers who track consistently earn more over time, not because the data is magic, but because they stop flying blind.
— sadler
Serveriq makes earnings tracking simple for restaurant servers
Tracking your tips and wages should take less time than a side of fries takes to cook. Serveriq is built specifically for servers and bartenders who need a fast, clear way to monitor their income without a spreadsheet or a finance degree.
For $3 per month, Serveriq lets you log shifts by voice through Chip, the app's built-in assistant, and generates detailed earnings reports that show tip trends, effective hourly rates, and shift comparisons. Those reports give you the data to request better sections, plan your finances, and understand exactly where your income comes from. Visit the Serveriq subscription page to start tracking your earnings with the clarity your shifts deserve.
FAQ
What is a server performance reporting cycle?
A server performance reporting cycle is a regular process of logging shift data, reviewing earnings trends, and generating reports to guide scheduling and service decisions. Most servers benefit from weekly reviews and monthly comparison reports.
Which metrics matter most for restaurant server performance?
Effective hourly rate and tip percentage per cover are the two most revealing metrics. They show earning power and service quality more accurately than total tips alone.
How often should servers review their earnings reports?
Weekly summaries catch short-term anomalies, while monthly comparisons reveal earning trends. Percentile-based metrics show performance across your best and worst shifts, not just your average.
What is the 5-minute rule for server performance alerts?
The 5-minute rule means only treating a performance concern as real when it persists across multiple data points, not a single bad shift. This prevents overreaction to normal variation in tips and table flow.
How does Serveriq help with performance reporting?
Serveriq tracks tips, hourly wages, and shift data through voice commands via its assistant Chip, then generates earnings reports that show trends and patterns. The app costs $3 per month and is built specifically for food service workers.