
Containerized server monitoring is defined as the continuous tracking of resource usage, health, and performance of containerized applications across multiple infrastructure layers, including the host, container runtime, orchestrator, and application. For restaurant IT professionals managing point-of-sale systems, kitchen display software, and inventory platforms, this practice is not optional. Containers are ephemeral by nature, meaning they can exist for only minutes or hours, and standard server monitoring tools simply do not capture that lifecycle accurately. The result of poor monitoring is degraded application performance, dropped transactions, and a worse experience for guests and staff alike.
What is containerized server monitoring, and why does it matter?
Containerized server monitoring is the practice of observing and analyzing every layer of a container's lifecycle, from the physical host up through the application itself. The industry term for this broader discipline is container observability, and it combines metrics, logs, and traces to give IT administrators a complete picture of system health. Treating containers like traditional virtual machines is the single most common mistake restaurant IT teams make.
Monitoring must integrate all layers to produce results you can act on. A container can appear perfectly healthy at the host level while an orchestrator issue quietly degrades performance for every guest-facing application running on that server. That gap between "looks fine" and "is fine" is exactly what containerized server monitoring closes.
Restaurant environments add a specific layer of urgency. A failed payment terminal or a crashed kitchen display during a dinner rush is not an abstract IT problem. It is lost revenue and frustrated staff. Container monitoring gives IT administrators the visibility to catch problems before they reach the floor.

What key metrics are essential for container server performance monitoring?
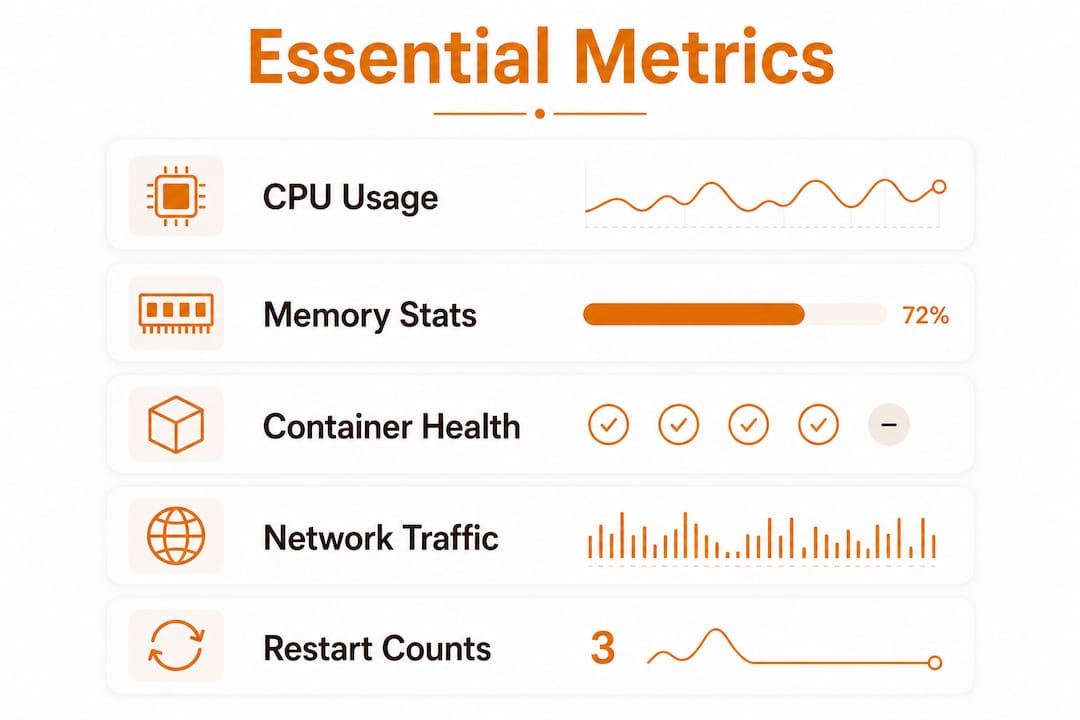
The right metrics tell you what is happening inside each container before a problem becomes visible to users. CPU usage is the starting point, but it is not the whole story.
The metrics that matter most:
- CPU throttling time (
nr_throttled): A container can show low average CPU usage while being actively throttled. Monitoring CPU throttling alongside raw CPU usage catches performance bottlenecks that basic dashboards miss entirely. - Memory resident set size (
container_memory_rss): General memory usage metrics are inflated by cached data. Usingcontainer_memory_rssmeasures actual physical memory consumption and prevents false out-of-memory alerts. - Disk I/O and network traffic: High disk read/write rates inside a container running a restaurant's database can signal a query problem long before the application throws an error.
- Container lifecycle events: Out-of-memory kills and unexpected restarts are leading indicators of resource contention. Tracking these events gives you a timeline to work backward from.
- Per-container isolation metrics: On a host running 50 or more containers, isolation metrics prevent one container from starving the resources of others, a problem known as the noisy neighbor effect.
Each metric above answers a specific question. CPU throttling tells you whether a container is being artificially slowed. Memory RSS tells you whether you are actually running out of physical memory or just seeing cache. Lifecycle events tell you whether the system is recovering from failures silently.
Pro Tip: Never rely on a single memory metric. Always compare container_memory_usage_bytes against container_memory_rss to separate cached data from real consumption. Acting on inflated numbers leads to unnecessary container restarts and wasted troubleshooting time.
How does containerized application monitoring differ from traditional server monitoring?
Traditional server monitoring assumes a stable, long-lived process running on a fixed IP address. Container monitoring operates under entirely different rules. Containers start, stop, and restart constantly, and their IP addresses change with each lifecycle event.
The table below shows the core differences between the two approaches.
| Dimension | Traditional server monitoring | Container monitoring |
|---|---|---|
| Lifespan | Hours to years | Minutes to hours |
| IP address | Static | Dynamic, changes on restart |
| Scaling | Manual, planned | Automatic, event-driven |
| Discovery | Manual configuration | Automatic service discovery |
| Monitoring layers | Host and application | Host, runtime, orchestrator, app |
Automatic service discovery solves the IP-change problem by letting the monitoring system adapt instantly when containers start or stop. Without it, your monitoring configuration is outdated the moment a container restarts. This is a non-issue in traditional environments but a critical requirement in containerized ones.
Container density also changes the math on resource contention. A single physical server in a restaurant's back office might run a dozen containers simultaneously, each sharing the same kernel. One misbehaving container can degrade all of them. Traditional monitoring tools see only the host-level aggregate and miss the per-container breakdown entirely.
Pro Tip: If you are migrating from VM-based monitoring, resist the urge to copy your existing alert thresholds. Container workloads spike and recover far faster than VM workloads. Thresholds tuned for VMs will generate constant false alerts in a container environment.
What container monitoring tools work best for restaurant IT infrastructure?
The right toolset depends on your server's available resources and the complexity of your container environment. The following stack covers the full observability requirement for most restaurant IT setups.
-
cAdvisor (Container Advisor): Google's open-source tool collects per-container metrics directly from the Docker runtime. Its built-in UI gives you immediate metric visualization for quick debugging. The limitation is that cAdvisor lacks alerting and historical data storage, making it a diagnostic tool rather than a production monitoring solution on its own.
-
Prometheus: Prometheus scrapes metrics from cAdvisor and stores them in a time-series database. The recommended scrape interval is 10–15 seconds to capture performance spikes without overwhelming nodes with limited RAM, such as servers with 8 GB of memory.
-
Grafana: Grafana connects to Prometheus and turns raw metric data into dashboards your team can actually read. Building a dashboard that surfaces CPU throttling, memory RSS, and container restart counts gives on-call staff a single screen to check during an incident.
-
Fluent Bit: Log aggregation is the piece most teams skip. Without structured log aggregation, containers remain black boxes regardless of how many metrics you collect. Fluent Bit is lightweight enough to run on resource-constrained restaurant servers and forwards container logs to a central store.
-
Docker HEALTHCHECK: Docker's built-in health check feature reports application-level status, not just whether a process is running. Health failures trigger alerts and automated orchestrator responses, which is the foundation of a self-healing container setup.
One critical operational note: cAdvisor can generate 200–300 metric series per container. Aggregation and relabeling reduce storage and query overhead at scale. For a restaurant server running dozens of containers, this is not a theoretical concern. It is a real cost you need to plan for before you deploy.
For a broader look at cost-effective options, the affordable management tools list for restaurants covers additional solutions suited to tighter budgets.
What are the best practices for container monitoring in restaurant environments?
Effective monitoring in a restaurant IT environment requires discipline across four areas: what you collect, when you alert, how you respond, and how much overhead you accept.
Monitor all four layers without exception. Host metrics, container runtime metrics, orchestrator health, and application-level checks each answer different questions. Skipping any one layer creates a blind spot. Full observability requires metrics, logs, and traces working together, not metrics alone.
Set alert thresholds based on your actual workload pattern. Restaurant traffic is not uniform. Lunch and dinner rushes create predictable spikes. Alerts tuned to flat baselines will fire constantly during peak hours and miss real problems during slow periods. Review your thresholds against historical traffic data at least once a quarter.
Automate your response to common failures. Docker HEALTHCHECK combined with orchestrator restart policies creates a self-healing loop for the most common container failures. Automating the response to an out-of-memory kill or a failed health check means the system recovers before a server or manager notices anything is wrong.
Balance data granularity against hardware limits. More data is not always better. A comprehensive data collection strategy must account for the monitoring overhead itself. On a restaurant server with limited RAM, a 10-second scrape interval with targeted metric selection outperforms a 5-second interval collecting everything cAdvisor offers.
For deeper context on tracking application health inside containers, the application performance monitoring guide for IT professionals covers the observability principles that apply directly to containerized restaurant systems.
Pro Tip: Correlate your container restart events with your POS transaction logs. A spike in container restarts that aligns with a high-volume service period is a resource contention problem. A spike that occurs at random times is more likely a memory leak or a misconfigured health check.
Key Takeaways
Effective containerized server monitoring requires tracking all four infrastructure layers, using the right metrics, and correlating data across metrics, logs, and traces to diagnose problems before they affect restaurant operations.
| Point | Details |
|---|---|
| Monitor all four layers | Host, runtime, orchestrator, and application each reveal different failure modes. |
Use container_memory_rss | This metric reflects actual physical memory use and prevents false out-of-memory alerts. |
| Track CPU throttling | A container can be throttled even when average CPU usage looks normal. |
| Set workload-aware thresholds | Tune alerts to restaurant traffic patterns, not flat baselines, to reduce noise. |
| Automate failure responses | Docker HEALTHCHECK and orchestrator restart policies create self-healing systems. |
What I've learned from monitoring containers in restaurant IT
The biggest mistake I see restaurant IT teams make is treating container monitoring as a one-time setup task. You deploy cAdvisor and Prometheus, build a Grafana dashboard, and assume the job is done. It is not. Container environments change constantly, and your monitoring configuration needs to change with them.
The CPU throttling blind spot is the one that catches teams off guard most often. A container running your inventory sync service can show 30% average CPU usage on every dashboard while being throttled 40% of the time. The average looks fine. The application is slow. Nobody connects the two until a manager complains that the end-of-night report takes twice as long as it should.
Log aggregation is the other area where I see teams cut corners. Metrics tell you what is happening. Logs tell you why. Running Fluent Bit alongside Prometheus costs almost nothing on modern hardware, and it transforms your ability to diagnose problems quickly. Without it, you are debugging by guessing.
The tools in this space are maturing fast. Kubernetes-native observability platforms now handle service discovery, metric collection, and alerting in a single deployment. For restaurant IT teams managing more than a handful of containers, that consolidation is worth evaluating seriously. The goal is always the same: know what your containers are doing before your guests notice that something is wrong.
— sadler
Serveriq and monitoring for restaurant technology teams
Restaurant IT teams need monitoring tools that fit the reality of their environment, which means limited hardware, variable workloads, and zero tolerance for downtime during service.
Serveriq is built for the people who keep restaurant technology running. Whether you are tracking shift-level performance data or managing the financial side of your restaurant's server staff, Serveriq gives you clear reporting without the complexity. For $3 per month, the platform tracks tips, hourly wages, and variable pay through a simple interface, including voice-driven logging with the built-in assistant Chip. Visit the Serveriq subscription page to see how the platform fits into your restaurant's workflow.
FAQ
What is containerized server monitoring?
Containerized server monitoring is the continuous tracking of resource usage, health, and performance across all layers of a container's lifecycle, including the host, runtime, orchestrator, and application. It differs from traditional server monitoring because containers are ephemeral and require dynamic, automated observation.
Why is CPU throttling important to monitor in containers?
A container can show low average CPU usage while being actively throttled, which degrades application performance without triggering standard CPU alerts. Monitoring the nr_throttled metric alongside raw CPU usage catches this hidden bottleneck.
What is the recommended Prometheus scrape interval for restaurant servers?
A scrape interval of 10–15 seconds balances capturing performance spikes against the storage and processing overhead on nodes with limited RAM, such as servers with 8 GB of memory.
How does automatic service discovery help with container monitoring?
Automatic service discovery updates the monitoring system instantly when containers start, stop, or restart and change IP addresses. Without it, monitoring configurations become outdated every time a container lifecycle event occurs.
What is the difference between container_memory_usage_bytes and container_memory_rss?
container_memory_usage_bytes includes cached data and overstates actual memory consumption. container_memory_rss measures only physical memory in use, which produces more accurate alerts and prevents unnecessary out-of-memory kills.