
Real-time server telemetry is the automated, continuous collection and transmission of operational data from restaurant server systems, including POS terminals, kitchen display systems, and edge devices, to a central platform for immediate visibility. For IT professionals managing restaurant infrastructure, this data is the raw input that powers every monitoring and observability decision you make. Without it, you are reacting to outages instead of preventing them. Understanding what telemetry is, how it flows, and where it fits in your stack is the first step toward building a truly proactive restaurant IT operation.
What is real-time server telemetry in restaurant environments?
Real-time server telemetry is defined as the continuous emission of metrics, logs, and traces from restaurant server infrastructure to a central collection system. The industry shorthand for these three data types is MELT: metrics, events, logs, and traces. Each type tells a different part of the story about what your systems are doing right now.
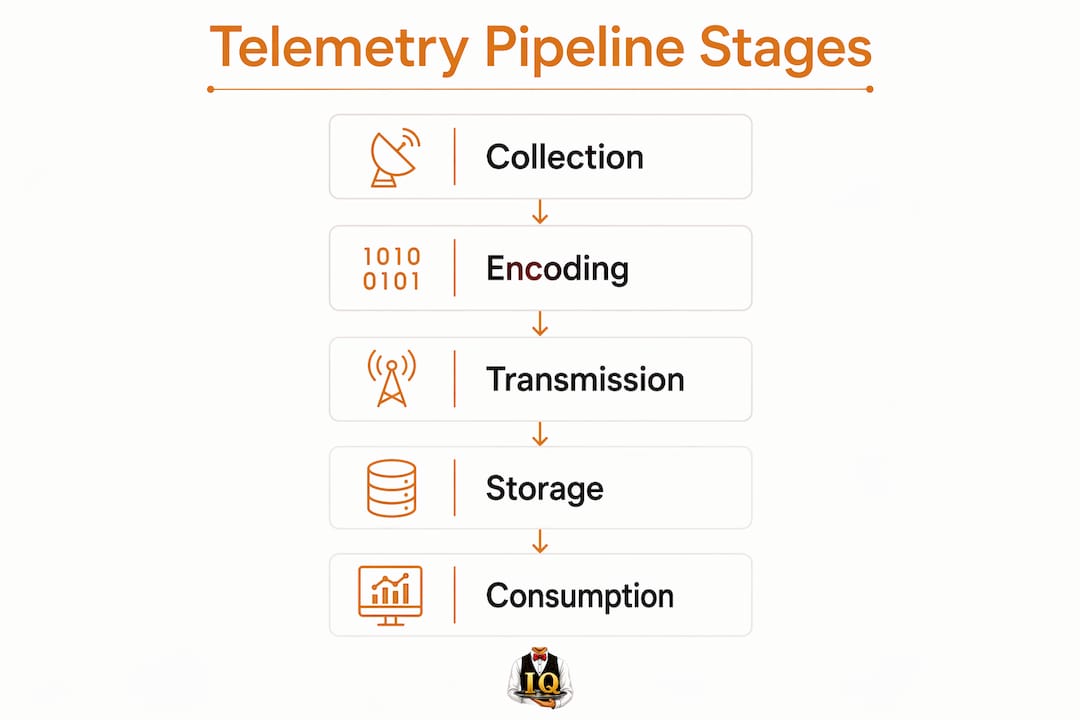
Telemetry is not a tool. It is a pipeline. That pipeline involves encoding, transmission, storage, and consumption stages, and every stage introduces opportunities for data loss or delay. Restaurant IT teams often conflate telemetry with monitoring, but the distinction matters. Telemetry is the raw data. Monitoring is what you do with it.
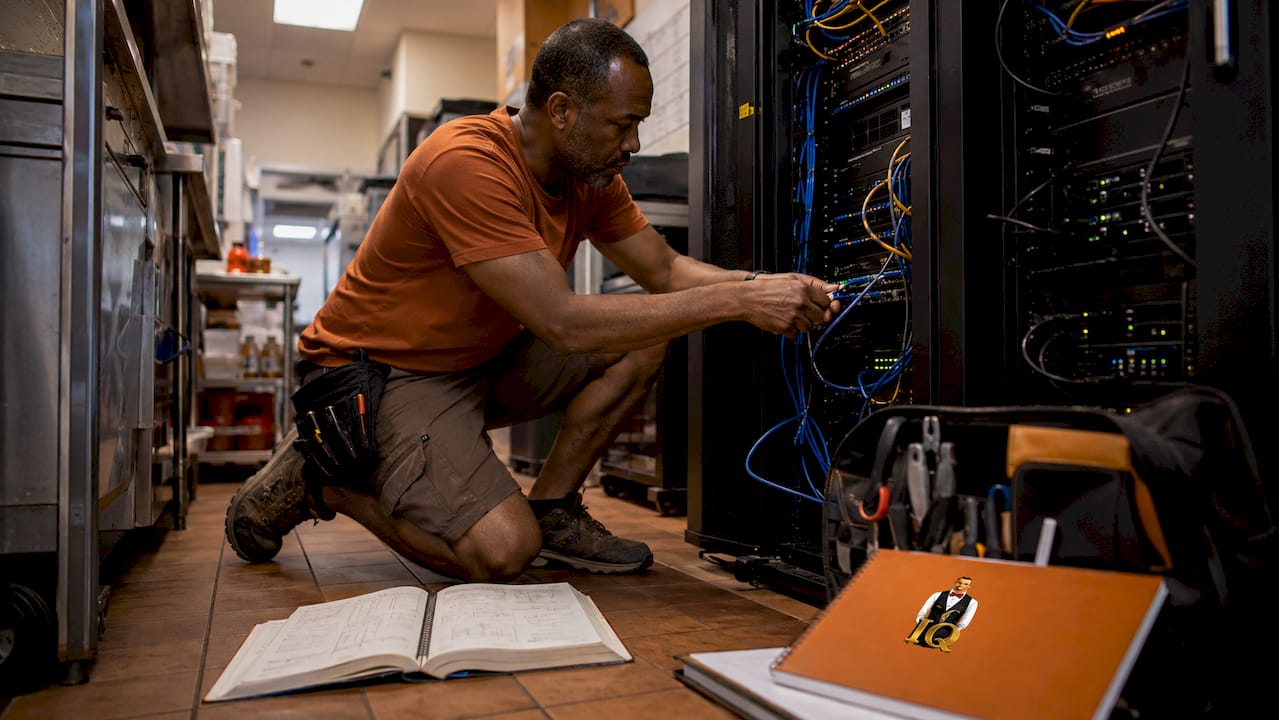
The concept applies directly to restaurant server profiling and performance tracking across your POS network. A single busy restaurant location may run dozens of endpoints, from handheld order tablets to back-of-house inventory terminals, each generating telemetry continuously. Managing that data well is what separates a reliable operation from one that goes dark during a Saturday dinner rush.
What types of data make up restaurant server telemetry?
Standard server telemetry covers six core metric categories: CPU utilization, memory use, disk I/O, network bandwidth, server temperature, and power consumption. Each one signals a different failure mode. A spike in disk I/O on a POS terminal during peak hours often predicts a storage bottleneck before it becomes a transaction failure.
Beyond raw metrics, telemetry includes:
- Metrics: Numeric measurements sampled at regular intervals, such as CPU load on a kitchen display server every 10 seconds
- Logs: Time-stamped records of discrete events, like a failed payment gateway call or a POS software crash
- Traces: End-to-end records of a single request as it moves through your system, from the server's tablet to the POS backend to the payment processor
- Environmental data: Temperature and power readings from hardware in hot kitchen environments, where thermal stress accelerates hardware failure
Logs capture the operational events that metrics miss. A metric tells you memory usage is at 94%. A log tells you exactly which process consumed it and when. Traces show you where a slow transaction actually stalled, whether at the network layer, the application layer, or the payment API.
Pro Tip: Set up metric collection at 15-second intervals on POS hardware during lunch and dinner rush windows. Coarser intervals miss the short-lived spikes that cause transaction timeouts.
Early detection of capacity issues reduces downtime during high-demand periods. For a restaurant running 300 covers on a Friday night, a POS terminal going offline costs real revenue, not just IT credibility.
How does server telemetry work in restaurant IT pipelines?
The telemetry pipeline in a restaurant environment follows a consistent architecture, even when the specific tools vary. Understanding each stage helps you identify where data quality problems originate.
- Collection: Lightweight software agents run on each POS terminal, kitchen display unit, or edge device. These agents sample metrics, capture logs, and record traces at configured intervals.
- Transmission: Data travels from agents to a central collector using protocols like OTLP or gRPC. OTLP, the OpenTelemetry Protocol, has become the standard for unified telemetry transmission across heterogeneous restaurant tech stacks.
- Filtering and enrichment: The collector applies metadata tags, such as location ID, terminal type, and shift time, and filters out low-value noise before ingestion. This stage also handles data masking for PCI compliance, stripping cardholder data from logs before they reach storage.
- Storage: Processed telemetry lands in a time-series database or a log aggregation platform, where it becomes queryable.
- Consumption: Monitoring dashboards, alerting rules, and observability tools read from storage to surface actionable signals.
| Pipeline stage | Primary function | Restaurant-specific concern |
|---|---|---|
| Collection | Agent-based data capture | POS and kitchen display hardware diversity |
| Transmission | OTLP/gRPC data transport | Low-latency LAN and Wi-Fi reliability |
| Filtering | Noise reduction, masking | PCI DSS cardholder data protection |
| Storage | Time-series or log aggregation | High-cardinality data volume control |
| Consumption | Dashboards and alerting | Shift-aware alerting thresholds |
Containerized restaurant applications add another layer. When your POS backend runs in containers, sidecar telemetry agents sit alongside each service container, collecting data without modifying the application itself. This pattern keeps collection close to the source and reduces network overhead.
Pro Tip: Normalize all telemetry at the collector stage using OTLP. Unified data formats let you correlate a slow kitchen display response with a CPU spike on the POS server without manual data wrangling.
Streaming-first architecture is not optional for true real-time capability. Batch ingestion with long windows introduces detection delays that turn a 30-second problem into a 5-minute outage before your team even gets an alert.
What are the benefits of real-time telemetry for restaurant server management?
The practical benefits of continuous telemetry break into four categories: early failure detection, performance optimization, security monitoring, and capacity planning.
Early failure detection is where telemetry pays for itself fastest. Standard server telemetry metrics help detect bottlenecks and anticipate hardware failure before they cause outages. A POS terminal showing rising disk temperatures and increasing I/O wait times is telling you it needs attention before it fails mid-service.
Performance optimization during peak periods is the second major win. Telemetry data from your lunch rush shows exactly which terminals slow down, which network segments saturate, and which application processes consume disproportionate resources. You can act on that data before the dinner rush repeats the same pattern.
Security monitoring is a less obvious but critical benefit. Continuous telemetry enables spotting security anomalies like repeated failed logins, unusual outbound traffic, or unauthorized software installations on POS hardware. In a restaurant environment where staff turnover is high and physical access to terminals is frequent, this matters.
"Continuous telemetry monitoring can reveal unauthorized equipment or software in restaurant environments, improving security posture. Deviations from baseline performance are often the first signal of a compromise, not a traditional security alert."
Capacity planning closes the loop. Telemetry data over weeks and months shows you seasonal patterns, growth trends, and the point at which your current hardware will no longer handle transaction volume. That data drives hardware refresh decisions with evidence instead of guesswork.
Understanding the difference between telemetry, monitoring, and observability also shapes how you plan server maintenance windows without disrupting service.
What are the common challenges when implementing telemetry in restaurants?
Telemetry adoption in restaurant IT environments fails in predictable ways. Knowing the pitfalls in advance saves significant rework.
- Confusing telemetry with monitoring: Telemetry is the raw data layer. Monitoring and observability are built on top of it. Teams that treat their monitoring dashboard as their telemetry system miss the underlying data quality problems that make alerts unreliable.
- Telemetry sprawl: Collecting every available metric from every device without filtering creates high-cardinality data that overwhelms storage and inflates costs. A restaurant with 50 terminals generating unfiltered telemetry at 1-second intervals produces more data than most small IT teams can process usefully.
- PCI compliance gaps: Logs that capture raw transaction data without masking create compliance exposure. Filtering and masking at the collection stage is not optional in any environment that handles cardholder data.
- Batch vs. streaming confusion: Many entry-level telemetry setups default to batch ingestion. That works for historical reporting but fails for real-time alerting. A batch window of 5 minutes means a POS failure during peak service goes undetected for up to 5 minutes before an alert fires.
- Containerization complexity: Restaurants moving POS backends to containerized infrastructure often find that traditional agent-based collection breaks. Sidecar agents solve this, but they require deliberate configuration.
Pro Tip: Start with a telemetry data inventory before deploying agents. List every device type, its data output format, and its compliance classification. That inventory prevents both sprawl and compliance gaps from day one.
Key Takeaways
Real-time server telemetry is the foundational data layer that makes proactive restaurant IT operations possible, and its value depends entirely on pipeline quality, not just collection volume.
| Point | Details |
|---|---|
| Telemetry is raw data, not a tool | Metrics, logs, and traces power monitoring and observability but are not the same thing. |
| MELT data covers all signal types | Metrics, events, logs, and traces together give complete visibility into restaurant server behavior. |
| Streaming-first pipelines are required | Batch ingestion delays alerts; streaming enables detection within seconds during peak service. |
| PCI compliance starts at collection | Mask cardholder data at the collector stage, before it reaches storage or dashboards. |
| High-cardinality data needs filtering | Unfiltered telemetry from dozens of POS terminals creates storage costs and unusable noise. |
Why telemetry is the foundation, not the finish line
Restaurant IT teams often invest heavily in monitoring dashboards and alerting platforms, then discover their alerts are noisy, slow, or missing critical signals. The root cause is almost always the telemetry layer underneath. The dashboard is only as good as the data feeding it.
What I have seen repeatedly in restaurant technology deployments is that teams treat telemetry as a checkbox. They install an agent, confirm data is flowing, and move on. The real work is in the pipeline design: what you filter, what you enrich, what you mask, and how fast it all moves. A telemetry pipeline that batches data every 5 minutes is not a real-time system, regardless of what the vendor calls it.
The streaming-first principle is the single most important architectural decision you will make. Once you commit to streaming, every downstream tool, from alerting to anomaly detection, becomes more responsive. That responsiveness is what lets your team catch a failing POS terminal before the server running table 12 has to tell a guest the system is down.
The other thing worth saying plainly: telemetry standards like OTLP exist precisely because restaurant IT environments are heterogeneous. You have legacy POS hardware, modern tablets, cloud-connected kitchen displays, and third-party payment processors all generating data in different formats. OTLP normalization at the collector is what makes all of that data comparable and actionable.
Telemetry is not the end solution. It is the raw material. Build the pipeline right, and everything built on top of it works better.
— sadler
Serveriq and real-time earnings visibility for restaurant teams
Restaurant technology is not just about POS uptime. The people running those terminals, your servers and bartenders, need their own real-time data layer to manage their earnings with the same clarity you bring to infrastructure monitoring.
Serveriq is built specifically for servers and bartenders who want continuous visibility into their tips, hourly wages, and shift earnings. For $3 per month, the app tracks every form of pay and surfaces patterns through detailed reports. The virtual assistant Chip lets staff log shifts and update earnings through voice commands, removing the friction that makes manual tracking fail. If your restaurant team wants the same kind of real-time insight into their income that you bring to your IT stack, the Serveriq subscription is the place to start.
FAQ
What is real-time server telemetry?
Real-time server telemetry is the automated, continuous collection and transmission of metrics, logs, and traces from server infrastructure to a central system for immediate visibility. It is the raw data layer that powers monitoring and observability tools.
How does telemetry differ from monitoring?
Telemetry is the raw data emitted by systems. Monitoring is the practice of analyzing that data to detect known issues. Both are distinct, and monitoring quality depends directly on telemetry quality.
What protocols does restaurant server telemetry use?
Restaurant IT environments commonly use OTLP (OpenTelemetry Protocol) and gRPC for telemetry transmission. OTLP normalizes data from diverse sources, enabling unified correlation across POS terminals and kitchen systems.
Why does PCI compliance matter for telemetry pipelines?
POS systems handle cardholder data, which means any log or trace that captures transaction details must mask sensitive fields before storage. Filtering at the collection stage is the standard approach to maintaining PCI DSS compliance.
What is high-cardinality telemetry and why is it a problem?
High-cardinality telemetry occurs when data includes too many unique label combinations, such as per-transaction IDs, creating massive storage volumes and processing costs. Filtering and sampling strategies at the collector stage keep data manageable and useful.